R2V FREQUENTLY ASKED QUESTIONS
R2V Basics
Image and Vector Formats
-
The TIFF file created by my scanner software is incompatible with R2V, what should I do?
-
How to convert Radio Mobile coverage image (.PNG) to Shapefile?
Auto Vectorization
-
How do I vectorize a grayscale image, for example, a soil map?
-
How do I register the vectorized data set to a projection system in R2V?
-
How do I extract vector data from a scanned color aerial photo using R2V?
-
I have a color map, how do I separate the colors and vectorize each color?
-
How do I define regions of interest (ROI) for vectorization or cropping?
-
We need to enter text labels within vectorized polygons, how can we do that in R2V?
-
What are the steps involved when using R2V's OCR engine to detect texts in a map?
Image Processing
-
How to do Image Warping/Registration and Image Geo-referencing using R2V?
-
How do I merge multiple images to create an image overlay or mosaic?
Conversion Between Map Projection Systems
What is R2V? What can it do for me?
R2V is an advanced, raster to vector conversion software used for automated map digitizing, GIS data capture, and CAD drawing conversion. Because R2V has many functions specially designed for mapping and GIS applications, the automated map digitizing feature is the main application that users in more than 60 countries are working with.
R2V supports both fully automated raster to vector conversion and interactive, semi-automatic tracing to handle a wide variety of map types. R2V provides a complete set of editing tools for vector editing, control point selection, and image and text editing. R2V allows vector geo-referencing for any projection system using GeoTIFF or control points and supports the most commonly used vector formats, such as DXF, ArcView Shapefiles, MapInfo MIF/MID, IGES, SVG ( Scalable Vector Graphics) and many others.
R2V also provides many advanced image processing functions, such as unsupervised color classification, grayscale image background removal, image warp or rubber sheeting, image geo-referencing, image editing, and many more.
If you need to digitize maps or create vector data, the easiest way is to scan the hardcopy and let R2V vectorize it for you. You can then edit, label with attributes, select control points for geo-referencing, and export your data to the format you need.
Back to Top
Is R2V a stand alone software? Do I need other software to run R2V?
R2V is a stand alone software and you do not need any other software to run R2V.
Back to Top
What platforms (Operating Systems) does R2V run on?
R2V supports all Windows platforms (32-bit), including Windows NT, Windows 2000, Windows ME, Windows XP, Windows Vista and newer versions of Windows. R2V works on 64-bit Windows as a 32-bit application.
Back to Top
What type of hardware do I need to run R2V?
Most of today's PCs running Windows (NT/2000/ME/XP/VISTA) are adequate for running R2V. The following are some things you can do to improve your PC's performance:
- Maximize system memory (RAM).
- Faster CPU.
- Faster hard disk drive. Try to keep all your active data (project files, image files, vector files) on your local machine and move them to a network drive only when all processing is complete.
Does R2V run on a Unix system?
No, R2V does not have a Unix version.
Back to Top
Does R2V run on a Linux system?
R2V does not have a Linux version at this time. However, we are looking into the possibility of creating a Linux version for R2V.
Back to Top
Does R2V run on a Macintosh system?
No, R2V does not run on a Macintosh system.
Back to Top
What are the shortcut keys used in R2V?
R2V uses shortcut keys for quick access to some of the frequently used functions. You can also use the "Edit/Shortcut Keys" function to define your own shortcut keys.
The following is a list of keys used in R2V:
-
F1: Help function
-
F2: Zoom in. This can be used with a selection box drawn using the left mouse button.
-
F3: Zoom out.
-
F4: Start contrast adjustment dialog box for grayscale image.
-
F5: Full view, or fit the entire image in the window.
-
Control key + Left Mouse Button: Get distance measurement shown in the status bar at the bottom.
-
Shift key + Left Mouse Button: Draw a selection rectangle while in any editing mode.
-
"T" or "t" under Edit/Line Editor/New Line: Toggle auto tracing mode on and off.
-
"C" or "c" under Edit/Line Editor/New Line: Finish the current line by connecting to the start point to make a closed polygon.
-
"S" or "s" under Edit/Line Editor/New Line: Finish the current line and connect to another line end that's the closest.
-
Control-Z: Undo the last editing under the Edit/Line Editor menu.
-
Backspace(?): Undo the last addition when using the Edit/Line Editor/New Line command.
-
Spacebar: Finish the current line under Edit/Line Editor/New Line.
-
"N" or "n" or "ESC" under Edit/Line Editor/Join Lines: Cancels the current line join operation. Spacebar or any other key will join the lines.
Can R2V convert vector data to raster image?
Yes. Open your vector data file using the File/Vector Import command and then the File/Save Vector to Image command to rasterize the vector data into an image.
Back to Top
What image file formats are supported?
R2V supports TIFF, GEOTIFF, BMP, JPEG, GIF, RLC, and other raw image formats used to store satellite imagery. Most scanners can generate images in TIFF format, if not, you can simply use an image utility to convert them to TIFF, or a format supported by R2V.
Back to Top
What image types does R2V support?
R2V can vectorize most image types, including 1-bit monochrome or bi-level, 4-bit and 8-bit grayscale, and 8-bit and 24-bit color images.
Back to Top
Is there a limit on the image size that R2V can vectorize?
The R2V software itself is designed to handle very large size images, larger than 65536 by 65536 pixels. However, a PC system where R2V runs has a limited system memory (RAM) and hard disk space for swapping. In addition, R2V uses RAM to hold images for vectorizing and other processing tasks.
If you get a "Not enough memory" message when loading a large size image, there are 2 things you can do: 1) add more RAM, 2) increase "virtual memory size". While the second option may get rid of the warning, the first option will always improve performance significantly.
Back to Top
What vector output file formats does R2V support?
R2V can export vector data to ArcView Shapefiles, Arc/Info generate file, MapInfo MIF/MID, AutoCAD DXF, IGES, SVG ( Scalable Vector Graphics) and MapGuide SDL formats. Vector data is geo-referenced to any projection system using user selected control points, world file or GeoTIFF.
R2V can create 3D DEM data, which can be exported to USGS DEM, ASCII Grid, and XYZ format.
Back to Top
What is the Arc format? Is it a compressed file?
The Arc file R2V export is the same as the Arc/Info generate format. Since R2V version 5.0.6, the new file extension GEN is used to avoid confusion with some compression program. It's an ASCII format, and stores line data as:
ID1
X1, Y1
X2, Y2,
...
Xn, Yn
END
ID2
X1, Y1
X2, Y2
...
END
...
IDn
X1, Y1
X2, Y2
...
END
END
Where, each polyline starts with its ID, and is followed by the X, Y coordinates of all the vertices. It ends with the keyword "END".
Because some compression programs, such as WinZip, include extension ARC as a compressed file in the Explorer display window, it does not mean the file is compressed. The file is still an R2V Arc file in the format described here.
Back to Top
The TIFF file created by my scanner software is incompatible with R2V, what should I do?
R2V supports most of the TIFF file formats, however, there are over 200 different TIFF formats used by software and hardware vendors and some are non-standard and incompatible with R2V. If you encounter problems reading a TIFF image file, you can try the following options to solve this problem:
A. Check with your scanner software, make sure the image type scanned is supported by R2V. R2V supports 1-bit monochrome, 4 and 8-bit grayscale, and 8-bit and 24-bit color.
B. If the image is very large, you need to check to make sure your system has enough memory to read the image for processing. If this is the problem, you can do one of the following things: add more system memory (RAM), increase virtual memory size (swap file), or reduce the size of your image by scanning at a lower resolution level (dots per inch).
C. If the image type is supported by R2V, check the image compression method used. R2V supports most of the compression types, such as Pack-bits, LZW, Group III, and Group IV. If the image is read but does not display correctly, it is very likely the compression used is incompatible with R2V. In this case, recreate or resave your image without using any compression.
D. If the problem still happens, try to read the image using a third vendor graphics software to verify the image file. If it can be read successfully, save the image to a new TIFF file using the same graphics software.
Back to Top
What scanners are best for R2V? Do I need to buy one?
To use R2V to automate the digitizing process, you need to scan your maps first. Because R2V supports most of the image types, 1-bit monochrome (black/white), 8-bit grayscale, and 8-bit and 24-bit color, most of the good quality scanners do a fine job scanning maps. For typical paper maps, a scanning resolution between 200 DPI and 800 DPI works well. Normally you do not need a higher scanning resolution because most paper maps are not produced at that high of a resolution. Too low of a resolution will cause broken lines. Some experimenting will help you determine what image type and scanning resolution to use.
You need to pay careful attention if you want to scan your maps in color. If an image is scanned as an 8-bit color image, R2V's powerful color classification function won't be available. In this situation, the color information may be quite limited to perform a good vectorization. For 24-bit true color scans, while the spatial resolution (DPI, dots per inch) is important, the scanner's ability to accurately scan colors is even more important. One color may seem similar to another from one area to the next. You should try to classify the image to see if the colors are consistent throughout the entire image. This is crucial in getting the map vectorized at a high accuracy level. Color scanners vary greatly in terms of scanning quality.
Do you need to buy your own scanners? It depends on how big of a budget you have and how many maps you plan to digitize. Most R2V users doing a small number of map digitizing, use scanning service providers to scan maps for them. Then they use R2V for the vectorization process. They have found this very cost effective, as scanners are an expensive investment and hardware is always difficult to maintain. There are many scanning service providers who can scan your maps at a very low price with a very fast turnover. Our business partner page has a list for some scanning service providers who also use R2V.
If you are a large organization doing map digitizing on a regular basis, like some of our users, it is probably more convenient and cost effective to purchase your own scanner. When doing this, check with the scanner vendors for information on scanning resolution, distortion rate, what kind of scanning type they support, scanning speed, and most important, can the scanner work with the maps you need digitized. Always get some scanned samples, especially scans from your own maps, and try them with R2V to make the best choice.
Back to Top
How do I vectorize a parcel map?
A parcel map normally includes parcel boundaries in the form of closed polygons, text for parcel IDs, and other lines.
The following are some steps you can take to maximize automatic processing and minimize editing for digitizing parcel maps:
Step 1. Assume the image is a 1-bit monochrome image. Check the resolution to make sure the parcel boundary lines are connected. If not, you can use Image/Resize to downsample by 2 or more factors. You can also use the Image/Despeckle command a few times to remove noise.
Step 2. Image/Conversion/Convert to Grayscale. Note: If you do not want to change the image to grayscale, you can skip Step 2. At Step 3, define the color as the background color, and fill only lines you do not wish to vectorize. After the data is vectorized, you can save the vector lines and load the original image as the backdrop when doing editing.
Step 3. Select the Image/Image Pixel Tool On option. Change to the Fill Color mode. Define the color as 100, or something different from the background (255) or the lines(0). Move the cursor to a parcel line and click the left mouse button to fill. You'll see all connected parcel lines will turn to the new color. Repeat this step to fill all parcels.
Step 4. Select Image/Set Image Thresholds to adjust the threshold to include only the parcel lines (color around 100) to read and confirm this.
Step 5. Use the Vector/Auto Vectorize command. Make sure the "Use Existing Image Threshold" box is checked. Then start the process to vectorize only parcel boundaries.
Step 6. Edit the lines using the Edit/Line Editor options to remove non-boundary lines and any text that was vectorized.
Step 7. Select Vector/Create Polygon Layer to create polygons, use the Edit/Line Editor/Form Polygon command to close polygons if needed.
Step 8. Assign IDs to parcels if needed and export the vector data.
Back to Top
How do I vectorize a grayscale image, for example, a soil map?
A grayscale image can normally be vectorized using R2V's Vector/Auto Vectorize command.
Sometimes a grayscale image is stored as an 8-bit palette color image (use Image/Information to verify). If this is the case, you need to first convert the image to grayscale using Image/Conversion/8-bit Palette to Grayscale command and then use Vector/Auto Vectorize.
If you need to vectorize a certain grayscale range, for example, dark lines for soil boundary drawn on an aerial photo, you can use the Image/Set Image Thresholds command to determine the threshold first, and then use Vector/Auto Vectorize with the option "Use Existing Image Threshold" box checked.
You can also draw a selection box first to select a training area for the grayscale range, and then use Vector/Auto Vectorize.
Back to Top
How do I register the vectorized data set to a projection system in R2V?
R2V provides a way to register a generated vector data set to any projection system, such as UTM, etc.
To perform the registration, you need to go through the following steps:
Step 1. After the vector data set is created using the vectorization function, start the Control Point selection tool by selecting the Vector/Select Control Points option.. The cursor changes to a cross cursor when it is moved into the image window. Now you can bring up the control point editing options using the right mouse button.
Step 2. Point and click at a known location to select. The control point dialog box will appear to ask you to enter the coordinate values for the registration. In other words, if you want to map image location (10, 10) to a location under the new projection system, say, (1000, 1000), then the source coordinates are (10, 10) while the destination coordinates entered should be (2000, 3000). Normally, 4 control points on the four corners are enough to make the registration although more can be selected. Note: The accuracy of the registration is totally dependent on how good the control points are that you selected, not on how many control points you used.
Step 3. There are some editing options available, such as New, Move, Modify and Delete. Make the selection in the floating pop-up menu by pressing the right mouse button. Select Done from the menu when finishing the selection.
Step 4. Select Export Vector from the File menu. R2V will ask you whether you want to apply the registration. Select "Yes" and provide a file name to save the registered vector data. The vector file is now available for your GIS or mapping applications.
Note: Since the vector data is geometrically transformed to the new coordinate system, they will no longer be aligned with your source image. Make sure you save a copy of the vector data without registration applied so you can edit the data later using the source image as the backdrop.
Back to Top
I know R2V is much easier and faster at digitizing a map than doing it manually, but is it as accurate as the manual digitizing?
In principle, automated raster to vector conversion performs a similar task as in manual digitizing using a digitizing tablet. However, there are many factors which can affect the accuracy of the digitizing process, such as resolution, consistency, stability, and others.
Normally, the human hand can reach about 1/40th (40 dots per inch) resolution. Now the digitizing process begins and one can assume that the digitizer is infinitely correct. BUT what of the hand (shaking, sloppy, distracted, tired, lazy, impatient, etc.) of the operator. On small areas which only take an hour or two where the operator is interested, keen, sober, alert, and intent, one could assume that perhaps 90% of all the points digitized are within 1/40th of one inch (at that map scale surface). But can this accuracy be guaranteed through the entire digitizing process (from a few days to weeks)? Of course not.
Optical scanners can have much higher resolution than human hands, from 200 DPI to 800 DPI or higher. With the high resolution scanned image, R2V has enough information to find and track the center line or boundary line to the resolution of the scanner. No spatial error is introduced in the automated vectorization process and the vector data is faithfully reproduced in vector form. Also, with the batch function in R2V, a number of scanned maps can be processed in batch automatically without any human intervention, this can save significant amounts of time and introduces a whole new way to digitize maps.
Scanning deletes much of the human intervention (except of course in the editing which cannot be avoided in most cases) and faithfully reproduces what it sees (assuming the equipment is calibrated correctly and that correct procedures are followed). It can be assumed, at this stage to be far more accurate than manual digitizing, especially with zoom tools that can be utilized during the editing.
Back to Top
How do I extract vector data from a scanned color aerial photo using R2V?
R2V has several functions for color image processing. It normally requires some combination of functions to extract vector data properly from color images due to their complexity. There are 3 types of color images supported in R2V.
The following will explain each type and how they can be vectorized.
A. 8-bit palette color. Image pixels are color coded and displayed with its defined color map. For an 8-bit palette color image, you need to select a training or feature region to indicate the colors to be vectorized. For example, if you want to get vector data for all the water boundaries, first draw a selection rectangle within a water area, such as river or lake. While the rectangle is displayed on screen, select the Vector/Auto Vectorize command. Then select the "Boundary Line" option to vectorize the region boundaries. You can repeat this process to vectorize another color feature and add the vector data to the current data set.
B. 24-bit true color. Each pixel has 3 color values, Red, Green and Blue. There are two methods that can be used to extract vector data in R2V.
Method 1. Same as 8-bit palette color image. See above.
Method 2. Classify the image first and then vectorize it. First, select the Image/Classification command. The classification is based on a clustering algorithm and is very fast. When selecting the number of classes for classification, do not make it too many because regions may get fragmented. Do some experimenting with the classification to see how many classes should be used for a certain type of image.
After the classification, if you want to get boundaries for all the classes, simply select the Vector/Auto Vectorize command. If only one class boundary is to be generated, you need to draw a selection rectangle within a class region to indicate the class to be vectorized. When the selection rectangle is still displayed, select Vector/Auto Vectorize to get the boundary. Repeat this process to add more class boundaries to the current dataset.
C. 8-bit classified image derived from a 24-bit true color image. This image can be created using R2V's color classification function. There are two methods that can be used to extract vector data from this type of image.
Method 1. Use the second step of method 2 for 24-bit true color image.
Method 2. If you want to have the option to vectorize either the boundary or the center line, you can simply convert the classified image to an 8-bit palette type image. They are interchangeable. Then follow the method described in A.
Back to Top
I have a large size map which is much bigger than my scanner can handle, so I scanned the map in 4 sections. Can I use R2V to vectorize the sections and then merge the vector data to a single set?
Yes. You can use the control points to help merge the sections together into a single set.
The following are the steps needed to do this:
Step 1. First, write down how the maps are divided. For example, the map is spliced into 4 equal size sections.
Step 2. Vectorize each section separately. For each section, select 4 control points (See question 1 for more details on how to select and edit control points). The way to define control points is simple. Think of the merged map set as the same size as if we scanned the map on a large scanner at the same resolution. For example, if the image size of each section is 100 (x) by 100 (y), then the control points for each section can be selected from the four corners and defined as (See figure below):
Section 1 (Top left): No registration is needed.
Section 2 (Top right section):
Point 1 (top left corner). Source (0, 0), Destination: (100, 0)
Point 2. (top right corner). Source (100, 0), Destination: (200, 0)
Point 3. (bottom left corner). Source (0, 100), Destination: (100, 100)
Point 4. (bottom right corner). Source (100, 100), Destination: (200, 100)
Section 3 (Bottom left section):
Point 1 (top left corner). Source (0, 0), Destination: (0, 100)
Point 2. (top right corner). Source (100, 0), Destination: (100, 100)
Point 3. (bottom left corner). Source (0, 100), Destination: (0, 200)
Point 4. (bottom right corner). Source (100, 100), Destination: (100, 200)
Section 4 (Bottom right section):
Point 1 (top left corner). Source (0, 0), Destination: (100, 100)
Point 2. (top right corner). Source (100, 0), Destination: (200, 100)
Point 3. (bottom left corner). Source (0, 100), Destination: (100, 200)
Point 4. (bottom right corner). Source (100, 100), Destination: (200, 200)
Step 3. Save the vector data of each section to an ARC file with a different name and say "YES" when asking if the mapping is applied.
Step 4. Select the File/New Workspace option to open an empty window.
Step 5. Use the File/Import Vector command to read the registered vector data of a section into this new Window. Repeat this for all three sections and be sure to keep the current data set when importing. After this step, the four vector data sets are merged into the Window. You can edit the data using the Edit/Line Editor or other Vector processing functions.
Step 6. Don't forget to save the merged data to a file. Use File/Export Vector to do this.
Back to Top
I have a color map, how do I separate the colors and vectorize each color?
For a good quality 24-bit image, the following are the steps suggested to perform the color separation process:
Step 1. Classify the image with the number of colors it contains using the Image/Classification command. This command can be applied to both 24-bit and 8-bit color images. Save this image to a new file so you can use it later to create a 1-bit monochrome image for each color to be vectorized.
Step 2. Use the Edit/Layer Define command to add new empty layers if you plan to have multiple layers for the data. You need to create the layers first and then add data to each layer using Vector/Auto Vectorize or other tools. When the Layer Define dialog box appears, you need to type the name of a new layer in the edit box at the bottom, and then click "New" button to add to the layer list. A layer must be set as "Current" to add data into it using Vector/Auto Vectorize.
Step 3. Define a selection rectangle within a color which is going to be vectorized and select the Vector/Auto Vectorize command. If you want to create a raster image with only this color, you can convert the classified image to a 1-bit bi-level monochrome image using the Image/Conversion/Classified ? 1-bit Bi-level command and then save the image to a new image file.
Note. You can repeat Step 3 by selecting a different color to vectorize or you can use the image saved in Step 1 to create a 1-bit monochrome image for another color.
For an 8-bit color image, for example, the scanned USGS topo maps, the following steps may be used:
Step 1. First, you need to purify the colors using R2V's Pixel Tool. Select Image/Image Pixel Tool On to turn on the editing tool. The default option is Show Pixel Value. Hold down the left mouse button and move the mouse to see the pixel color code at the cursor position. The color code is displayed at the bottom of the screen, in the form of an (X, Y) value.
Step 2. Write down the main color code of the feature you intend to vectorize, for example, the color code for brown contours. Then move your mouse along the contour lines and see if there are any other color codes. Write down the colors which belong to the contour lines but are different from the main color.
Step 3. Use the right mouse button to bring up the option menu, select the Map Pixel Value option. When the dialog box appears, enter the main color code in the New Value field, and enter a color code that needs to be changed in the Pixel Values to be Mapped field (see figure below). Click OK to perform the pixel mapping process. Repeat this process to map all the recorded color to the main color. When finished, use the right mouse button to bring up the option menu and select "Done".
After this process, the image will have a smaller number of colors.
Step 4. Use Edit/Layer Define to add new empty layers if you plan to have multiple layers for the data. You need to create the layers first and then add data to each layer using Vector/Auto Vectorize or other tools. When the Layer Define dialog box appears, you need to type the name of a new layer in the edit box at the bottom, and then click the "New" button to add to the layer list. A layer must be set as "Current" to add data into it using the Vector/Auto Vectorize option.
Step 5. To vectorize a color feature, hold down the left mouse button to draw a selection rectangle within a color and then select Vector/Auto Vectorize. Or you can convert the image to 1-bit Bi-level and then use the Vector/Auto Vectorize option.
Back to Top
When applying control points to the vectorized map, which method should be used, Bi-Linear or Triangulation?
Both the Bi-Linear and Triangulation methods will generate a geometric transform to project your vectorized map data from one coordinate system (most likely the raw image coordinate system) to another (most likely the map projection system you are going to use in a GIS software). However, the two methods work quite differently and you should select the one most suitable to your application.
Here are some guidelines for selecting the method that is right for you:
A. Bi-Linear corrects global distortion more effectively while Triangulation corrects local distortion better. The Bi-Linear method uses least-squares to generate one transform formula for the entire image no matter how many control points you have selected. Control point locations are not guaranteed to be at the exact same location after the transformation. So if you do not have too much local distortion and have a small number of control points, say 4 points at the corners, the Bi-Linear method is suggested.
B. The Triangulation method does the transformation quite differently. It divide the image space into many small triangles based on your selected control points and generates a formula for each triangle. Control point locations are maintained during the transforming process and local distortions are corrected effectively. However, because the scanned image corners (note, not your map corners) are critical in the triangulating process, some distortion may be introduced if you do not have any control points around the corners. This occurs because control points far away might be used. Therefore, you should have plenty of control points, evenly distributed in the entire image, including the four image corners in order to get a more accurate map projection. How many is plenty? You should have at least 4 at the corners and another 4 in other locations. More than 8 control points should give you very good results, based on the experiences of our users and our own experiences.
C. The target system is also quite important in determining what method to use when the vectorized map needs to be overlaid or merged into an existing data sets.
If you are exporting your data to Arc/Info or ArcView and using your raster image with the generated TFW (world file), the Bi-Linear method is your best bet, because Arc/Info and ArcView both use a similar Bi-Linear method.
If you are exporting your data to MapInfo and bringing your control points over with your raster image (TAB file), Triangulation is your best bet, because MapInfo uses a similar Triangulation method.
Back to Top
Can R2V vectorize a selected region of an image?
Yes. You can specify a region of interest using Image/Region of Interest (ROI) and then vectorize. This can be used repeatedly to vectorize several regions and put all the vector data into one layer. If you need to put the vector data of different regions into separate layers, save them to a file first and then vectorize a different region.
Back to Top
How do I define Regions of Interest (ROI) for vectorization or cropping?
R2V has a very easy to use, region of interest tool that supports circular, rectangular, and free-form polygon regions, or a combinations of these shapes for vectorization and image cropping.
Select one of the drawing tools under Image/Region of Interest (ROI) to start. Choose either Rectangle, Circle, or Polygon.
R2V supports multiple regions so you can define ROIs as separate areas or area with islands or holes. When multiple region boundaries are defined, caution must be taken to ensure that a region is either included or excluded.
The parity rule is used to determine if an area is inside the ROI or outside. It works like this: count the number of boundaries you encounter from the area to the outside of all boundaries. If the number is odd, then the area is inside, if the number is even then it is outside.
Once you are in the ROI editing mode, you can use the right mouse button to display the floating pop-up menu to switch to a different drawing mode. The currently selected drawing mode is shown with a check mark.
When in the polygon drawing mode, move the cursor to a position and click the left mouse button to start drawing. Move to the next position and click the left mouse button again to confirm the line segment. Repeat these steps to draw the region. The "Backspace" key will undo one step. Hit any key on the keyboard to close the region.
When in the rectangle drawing mode, move the cursor to a position for the upper-left corner of the rectangle. Hold down the left mouse button and drag to a position where the lower-right corner of the rectangle is. Release the left button and a rectangle boundary will be created. Repeat this step to add more rectangles.
The circle drawing mode is similar to the rectangle drawing mode. You need to draw the enclosing rectangle to define the circle. Move the cursor to a position for the upper-left corner of the rectangle. Hold down the left mouse button and drag to a position where the lower-right corner of the rectangle is. Release the left button and a circle or ellipse boundary will be created based on the bounding rectangle. Repeat this step to add more circles.
When finished, select "Done" from the floating pop-up menu to exit the ROI editing tool.
The region of interest (ROI) can be removed using the Image/Clear all ROIs command.
Use View/Overlay/Image ROI to toggle the display on and off. Once the region of interest is used by the vectorization process, it is removed. You can set a new region of interest by repeating the above steps.
Click here to see an example of an image cropped using region of interest.
Back to Top
We need to enter text labels within vectorized polygons, how can we do that in R2V?
After the map is vectorized and polygons are created, you can start R2V's Edit/Text Notes Editor to enter text labels. If you need to label the lines or polygons with ID values for your database use, use the Edit/Line Editor/Label Contours function to assign IDs to the lines.
Back to Top
What are the steps involved when using R2V's OCR engine to detect texts in a map?
Here are the main steps involved in detecting and recognizing text within a map using R2V's OCR engine. We simply list the functions used, so please check the R2V User Manual or the online help for more detailed information.
Step 1. Vectorize the image using the Vector/Auto Vectorize command.
Step 2. Perform vector post processing or editing if necessary.Step 3. Use the Detect Text Blocks command under the Vector menu to detect all text blocks. The text blocks are automatically grouped. Click here for more detailed information on this process.
Step 4. Start the Edit/Text Block Editor. First use the editor to remove false blocks, add missing text blocks, correct groups. Then train the OCR signature set using the Train OCR and Test OCR functions under the Text Block Editor.
Step 5. To train for a character, change to Train OCR mode. Click the left mouse button within a text block which contains the character, then a dialog box appears for entering the character or letter.Step 6. To test to see if a character can be recognized by the signature set, change to the Test OCR mode. Click the left mouse button within a text block. The recognized character or letter will appear in the message bar at the bottom of the image window. If it is not recognized correctly, use this text block to train the letter again.
Step 7. Once editing is done, use the Vector/Convert to Text Notes command. This command applies the OCR engine to process all the text blocks and convert them to text stored in Text Notes form in R2V.Step 8. You can edit text notes using the Edit/Text Notes Editor, if necessary.
Step 9. Save your project, and make sure the text notes are saved.
Step 10. Export the vector data to a GIS or Mapping vector file format.
Back to Top
I have a grayscale aerial photo, how do I segment the image and vectorize the boundaries of objects such as roof tops, parking lots and other homogeneous areas?
R2V has a grayscale image segmentation function designed for this purpose. If the image is in relatively good quality, use the Image/Segmentation function directly. After the image is segmented, you'll be prompted to select the grayscale threshold. Adjust the threshold so the regions you want to vectorize are in red color. Make sure the regions are separated from others when adjusting the threshold. Click on the "OK" button to continue the process. The boundaries are then vectorized automatically and the vector lines are displayed on top of the segmented image.
Edit the lines to fill in gaps and remove redundant lines. You can use all the options under the Edit/Line Editor menu. When lines are completely edited and cleaned up, use the Vector/Create Polygon Layer function if you plan to create closed polygons.
Back to Top
My map has irregular line intersection symbols such as circles, squares or bubbles, they are vectorized as the way they appear, how do I simplify them to single node intersections using R2V?
R2V has a set of functions to deal with the irregular line intersection problem.
Here are the steps suggested:
Step 1. Vectorize your image using the Vector/Auto Vectorize function.
Step 2. Draw a selection rectangle around one single intersection by pressing down the left mouse button. Because the size of the rectangle is very important, make it slightly bigger than the vectorized intersection symbol. Some experimenting with this will help.
Step 3. Detect the symbols using Vector/Detect Intersection Symbols. Blue rectangles surrounding the intersection symbols will be displayed. Other things such as small lines segments and patterns might be identified as intersection symbols but this is okay and will not cause any problem.
Step 4. Now it is time to correct or shrink the symbols. The following steps will physically change your vector data, so you may want to save the data to a file before you proceed. Because there might be misidentified symbols, you should use the Vector/Shrink Intersection Symbols function on a region by region basis. To do this, draw a selection rectangle using the left mouse button for a region where intersection symbols are identified correctly. When the selection rectangle is there, start the Vector/Shrink Intersection Symbols command. The symbols within the selected region are corrected. Repeat this process for other regions.
Step 5. If you want to correct the symbols individually, the Line Editor/Intersection Symbol option is the tool to use. Start the Line Editor, and switch to the Intersection Symbol editing mode. Click on an intersection symbol box to perform the correction. Undo can be used to recover if a mistake is made. If a symbol is not identified in the detection process, you can draw a selection box around it by holding down both the left mouse button and the SHIFT key and then select the Intersection Symbol option again to make the correction.
Back to Top
How do I create an image mosaic using R2V?
Creating an image mosaic is easy with the new Image/Mosaic command. This command can be used to merge smaller image sections together to overcome the limit of a scanner or simply to create a large image with all sections for easy processing.
The following are
the steps used to create an image mosaic: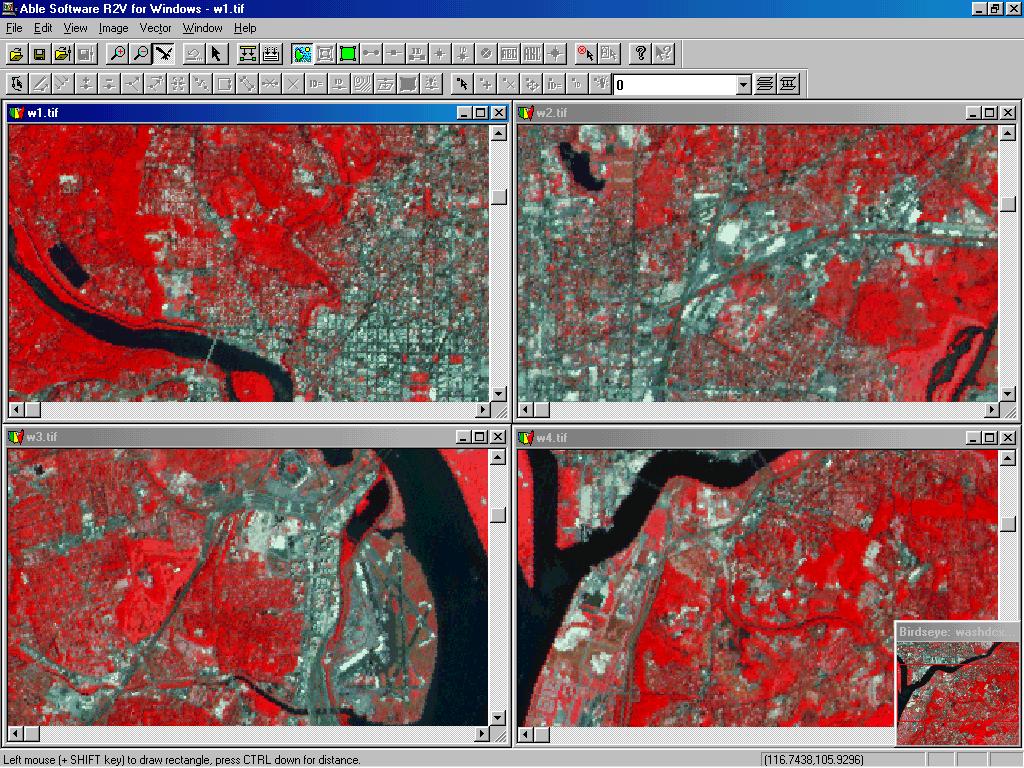
Step 1. First, prepare your images. If the images are not oriented in the same direction, use R2V's Image/Warp or Image/Rotate commands to correct the orientation. If the images have overlapping borders between neighboring images, use R2V's Image/Crop Region to remove the overlapping areas. If the images are not the same type, for example, 8-bit color and 24-bit color, you need to use R2V's Image/Conversion commands to convert them to the same image type. This is an example of 4 images that will be used to create an image mosaic.
Step 2. Select the Image/Mosaic command.
Step 3.
When the Image Mosaic dialog box appears, define
the mosaic
matrix and the names of the image files to be used for the
mosaic. Select "Create" and the
generated mosaic image will be
displayed. Save the image to a file or continue for more
processing.
This is the generated mosaic image from the 4 sub images.
Back to Top
How do I merge multiple images to create an image overlay or mosaic?
The commands under the submenu are used to interactively merge another image stored in a file to the current image to create an image overlay or mosaic. The process can be repeated to merge multiple images. If your images are in different scales, you can define control points and use Image/Warp to register the images first and then use the Image/Crop Region command to remove unneeded regions before merging them.
The following are the steps used to merge two images:
Step 1. Open the first image using the File/Open Image command.
Step 2. Select the Image/Merge/Open Image command. Use the file open dialog box to open the image you want to merge with the current image.
Step 3. Once the image is opened, it is displayed on top of the current image. The image and the overlapped area may look different from the normal display because the second image is inverted to show the overlap. Hold down the left mouse button to move the second image to the intended location for the new image and release to confirm.
Step 4. Click the right mouse button to show the options. Select Paste to paste the second image into the first image. If you want to show both images in transparent mode, select Fuse to combine the two images together. Click Cancel if you want to stop the process.
Step 5. The newly merged image is displayed in the current image window. Use File/Save Image As to save it to a new file.
Step 6. If you need to merge more images, repeat Steps 2 to 4.
Back to Top
What file extension should be used for the world file?
The world file defines geo-referencing information for a raster image. It is currently supported by many GIS software packages, including R2V, ESRI's Arc/Info and ArcView and some others. You can read a world file into R2V for image geo-referencing or create a world file using R2V from selected control points or a GeoTIFF file.
Although world file could have different file extensions depending on the image file extension, R2V uses only the TFW extension for all world files regardless what the image file extension has been used. You can change your world file to the TFW extension so it can get loaded automatically.
The world file consists of a six-parameter affine transformation :
x' = Ax + Cy + E
y' = Bx + Dy + F
Where, x' and y' are calculated coordinates of a pixel (x, y) in the world coordinate system ; A, B, C, D, E and F are the transformation parameters.
Back to Top
How to convert Radio Mobile coverage image to Shapefile?
Radio Mobile coverage image can be converted to Shapefile quite easily using R2V. The converted Shapefile can loaded in Google Maps, Google Earth, ArcGIS and other mapping and GIS software. Following are the steps:
- Open the coverage image in PNG, TIFF or other supported formats.
- The associated KML with the same name as the image file should be found automatically. You'll be asked if you want to use it for geo-referencing. Answer "Yes".
- If your image has a single color, you can convert the image to
grayscale first using the "Image/Conversion" command. If your image has
multiple colors, you can choose each color to vectorize separately.
- Use the "Auto Vectorize" and select the "Bounary Line Mode" to generate polygons from the coverage image.
- Use File/Export Vector command, select the Shapefile type and
enter a file name to export. Check the Box "Save closed lines as
polygons" and use "Bi-Linear" for geo-referencing. Click OK to get the
output file.
Back to Top
Coordinates conversion between UTM and Latitude/Longitude
R2V provides the Edit/Geo-Coord Convert/UTM and LL function to convert coordinates between UTM and geography coordinate system.
To
convert a point from latitude/longitude to a
UTM coordinate:
Step 1. Select the reference ellipsoid from the geodetic datum list.
Step 2. Enter the latitude and longitude values in the edit boxes. The latitude and longitude are in decimal degrees. East Longitudes are positive and west longitudes are negative. North latitudes are positive and south latitudes are negative.
Step 3. Click the “LL to UTM” button to do the conversion. The calculated UTM coordinates are displayed in the Northing and Easting edit boxes. The UTM zone number is also displayed.
Step 4. If your control points are defined using latitude and longitude and need to be converted to a UTM coordinate system, then click the “Convert Control Points to UTM” button to convert. Once the control points are converted, you can apply them when exporting your vector data.
To
convert a point from a UTM coordinate to
latitude/longitude:
Step 1. Select the reference ellipsoid from the geodetic datum list.
Step 2. Enter the UTM coordinate in the northing and easting edit box. UTM coordinates are in meters.
Step 3. Enter the UTM zone number. If you are not sure about the UTM zone, one simple way to generate it is to enter an approximate latitude and longitude value and click “LL to UTM” to calculate.
Step 4. Click the “UTM to LL” button to do the conversion. The calculated geography coordinates are displayed in the latitude and longitude edit boxes. Latitude and longitude are in decimal degrees.
Step 5. If your control points are defined using a UTM coordinate system and need to be converted to latitude and longitude, then click the “Convert Control Points to LL” button to convert. Once the control points are converted, you can apply them when exporting your vector data.
Back to Top
Coordinates conversion between State Plane and Latitude/longitude
Use Edit/Geo-Coord Convert/State Plane and LL command to convert coordinates between a State Plane coordinate system and the geography coordinate system (latitude/longitude).
To
convert a point from latitude/longitude to a State
Plane coordinate:
Step 1. Select the correct state plane and the zone number. The state plane name is displayed in the list with the zone number following the name. Check NAD27 if you are using NAD1927 or NAD83 if using NAD1983.
Step 2. Enter the latitude and longitude values in the edit boxes. The latitude and longitude are in decimal degrees. East Longitudes are positive and west longitudes are negative. North latitudes are positive and south latitudes are negative.
Step 3. Click the “LL to SPL” button to do the conversion. The calculated State Plane coordinates are displayed in the Northing and Easting edit boxes.
Step 4. If your control points are defined using latitude and longitude and need to be converted to a State Plane coordinate system, then click the “Convert Control Points to SPL” button to convert. Once the control points are converted, you can apply them when exporting your vector data.
To
convert a point from a State Plane coordinate
system to latitude/longitude:
Step 1. Select the correct state plane and the zone number. The state plane name is displayed in the list with the zone number following the name. Check NAD27 if you are using NAD1927 or NAD83 if using NAD1983.
Step 2. Enter your State Plane coordinates in the Northing and Easting boxes. State Plane coordinates are in meters.
Step 3. Click the “SPL to LL” button to do the conversion. The calculated geography coordinates are displayed in the latitude and longitude boxes. Latitude and longitude are in decimal degrees.
Step 4. If your control points are defined using a state plane coordinate system and need to be converted to latitude and longitude, then click the “Convert Control Points to LL” button to convert. Once the control points are converted, you can apply them when exporting your vector data.